Visualises
The processing load on the CPU with respect to time.
Synopsis
Time is displayed on the horizontal axis. The CPU load is displayed on
the vertical axis.
Colours are used to indicate the
actors that were running at any particular time (in this case, actors are
both FreeRTOS tasks and interrupts).
Just as in the main trace view, dragging the mouse adjusts the zoom
level. The graph resolution (or granularity) is adjusted using the
"Resolution" menu. A higher resolution is more sensitive to spikes in
the CPU load, while a lower resolution makes overall trends easier to view.
Click Events
The name of an actor is displayed when the corresponding colour is clicked
on the graph.
Double-clicking in the graph shows the corresponding interval in the trace view.
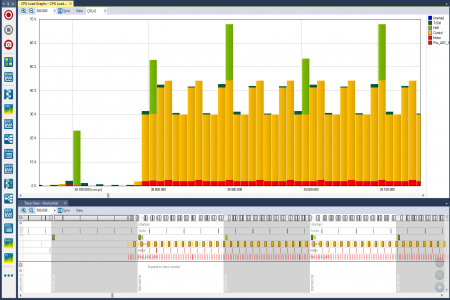
The CPU load view showing the CPU usage against time. Click to enlarge.
Copyright (C) Amazon Web Services, Inc. or its affiliates. All rights reserved.