FreeRTOS-Plus-Trace and FreeRTOS-Plus-CLI Demo
Using the FreeRTOS Win32 Simulator
Download
The example presented on this page is available in the following directory
of the offical
FreeRTOS zip file download:
FreeRTOS-Plus/Demo/FreeRTOS_Plus_CLI_with_Trace_Windows_Simulator
Introduction
This page describes a simple FreeRTOS example that runs in the
FreeRTOS Win32 simulator.
Using the simulator makes it easy to
evaluate FreeRTOS-Plus-CLI and FreeRTOS-Plus-Trace on a standard desktop PC, using
free development tools, and without the
need to connect any external hardware.
To keep everything as simple as possible, the FreeRTOS-Plus-CLI command line
interface is accessed through a UDP socket on the default Windows
loopback IP address of 127.0.0.1. Using the loopback adaptor allows the
demo to be used on a single computer, and without a live network connection.
The following commands are implemented:
|
Command String
|
Command Behaviour
|
|
trace
|
The trace command is used to start and stop the trace recording.
FreeRTOS-Plus-CLI will only process the command if it is entered
with exactly one parameter.
To start a FreeRTOS-Plus-Trace recording enter:
"trace start"
To stop a FreeRTOS-Plus-Trace recording enter:
"trace stop"
When a trace stops, results in the trace buffer are automatically
saved to the hard disk of the host computer. Instructions
on viewing the trace are provided further down this page.
|
|
echo_parameters
|
This demonstrates how to create and implement a command that
accepts a variable number of parameters. FreeRTOS-Plus-CLI will
not check the number of supplied parameters, and the
implementation of the command simply echos parameter back,
one at a time. For example, if the user enters:
"echo_parameters one two three four"
Then the generated out will be:
The parameters were:
1: one
2: two
3: three
4: four
|
|
echo_3_parameters
|
This demonstrates how to create a command that takes an
exact number of parameters. The command will not be
accepted by FreeRTOS-Plus-CLI unless exactly three parameters
are supplied. When the command is accepted, the
implementation of the command echos all three parameters
in a similar manner to the echo_parameters command detailed
above.
|
|
task-stats
|
Displays a table, each row of which shows state information
on a single task. Note that the displayed task stack high
water mark will not show a valid value when the Windows
simulator is being used.
|
|
run-time-stats
|
Displays a table,
each row of which shows the amount of time
a single task has spent in the running state. That is, how
much execution time has been allocated to each task. Both
absolute and relative values are displayed, although the
absolute times have no units when using the Windows simulator.
|
Demo Functionality
Two tasks and a single queue are used to generate a simple execution
pattern that can be viewed in the FreeRTOS-Plus-Trace graphical interface.
A low priority queue send task repeatedly sends a message to the queue.
A higher priority queue receive task repeatedly attempts to read a
message from the queue, blocking on the queue read operation when no
messages are available. An explanation of the resultant execution
pattern is provided below.
A trace monitoring task is also created that prints out a message
when it determines that the status of the trace recorder has changed
since it last executed.
It should be noted that, because the Windows simulator is being used,
the timing information displayed while the application is running, and
recorded in the trace log, have no meaningful units.
Building and executing the demo
-
Ensure Microsoft Visual C++ is installed.
The free Express version
can be used.
-
The Visual C++ solution file is called FreeRTOS_Plus_CLI_with_Trace.sln, and is
located in the FreeRTOS-Plus/Demo/FreeRTOS_Plus_CLI_with_Trace_Windows_Simulator
directory of the download. Double click the file to open Visual C++, or alternatively
open the file from within the Visual C++ IDE.
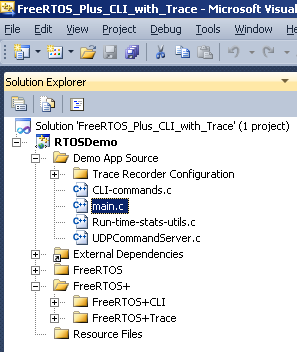
The RTOS project viewed in the Visual C++ IDE
Within the solution explorer:
-
The source files that implement the demo application are listed in the Demo App Source folder.
-
The source files that implement the FreeRTOS-Plus-CLI functionality are listed in the FreeRTOS-Plus/FreeRTOS-Plus-CLI folder.
-
The source files that implement the FreeRTOS-Plus-Trace recorder functionality are listed in the FreeRTOS-Plus/FreeRTOS-Plus-Trace folder.
-
The source files that implement the RTOS functionality are listed in the FreeRTOS folder.
-
Build, then execute, the project. (F7 will build the project, and F5 will execute the project).
Accessing the Command Console
The command console uses a UDP socket on IP address 127.0.0.1 and port 5001 to receive command
line input, and a UDP socket on the same IP address and port 5002 for output. A UDP console
program, such as the
free YAT utility,
can be used as a UDP interface. Note that 127.0.0.1 is the loopback IP address, so
a live network connection is not required.
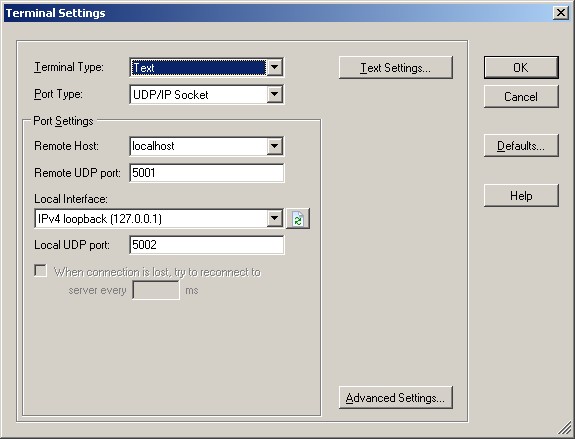 The required YAT terminal settings
Creating a FreeRTOS-Plus-Trace Recording
To create a trace recording:
-
Test the UDP connection between the UDP terminal and the running
application by running the "task-stats" and "run-time-stats"
commands.
-
Start the trace recorder by entering the "trace start"
command in the UDP terminal. Leave the
recording running for approximately five to ten seconds, then end the
recording by entering the "trace stop" command.
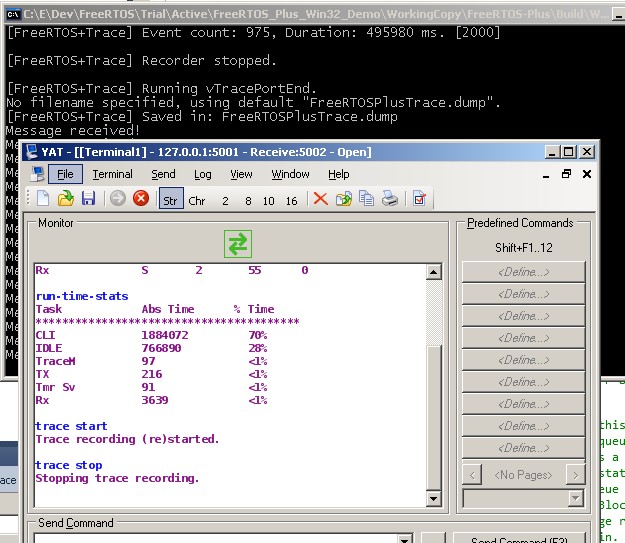 Screen capture after the RTOS trace has been started and stopped from the UDP console
Viewing the Trace Recording in FreeRTOS-Plus-Trace
To open and view the trace recording:
-
Download FreeRTOS-Plus-Trace
from the Percepio web site if you do not already have it installed.
-
Open the trace file from within the FreeRTOS-Plus-Trace application.
The trace file will have been saved as
FreeRTOSPlusTrace.dump in the directory that contains
the Visual Studio project.
-
The trace data will be displayed in the main FreeRTOS plus
trace window. Scroll the trace display down until you notice
"Tx" and "Rx" markers on the left side of the screen. These are
the times during which the queue send and queue receive tasks
were executing respectively. Zooming in on that region will
result in a display similar to the screen shot below. Note that
the screen shot has all the visibility filters ticked, not all
of which are available in the free FreeRTOS-Plus-Trace edition.
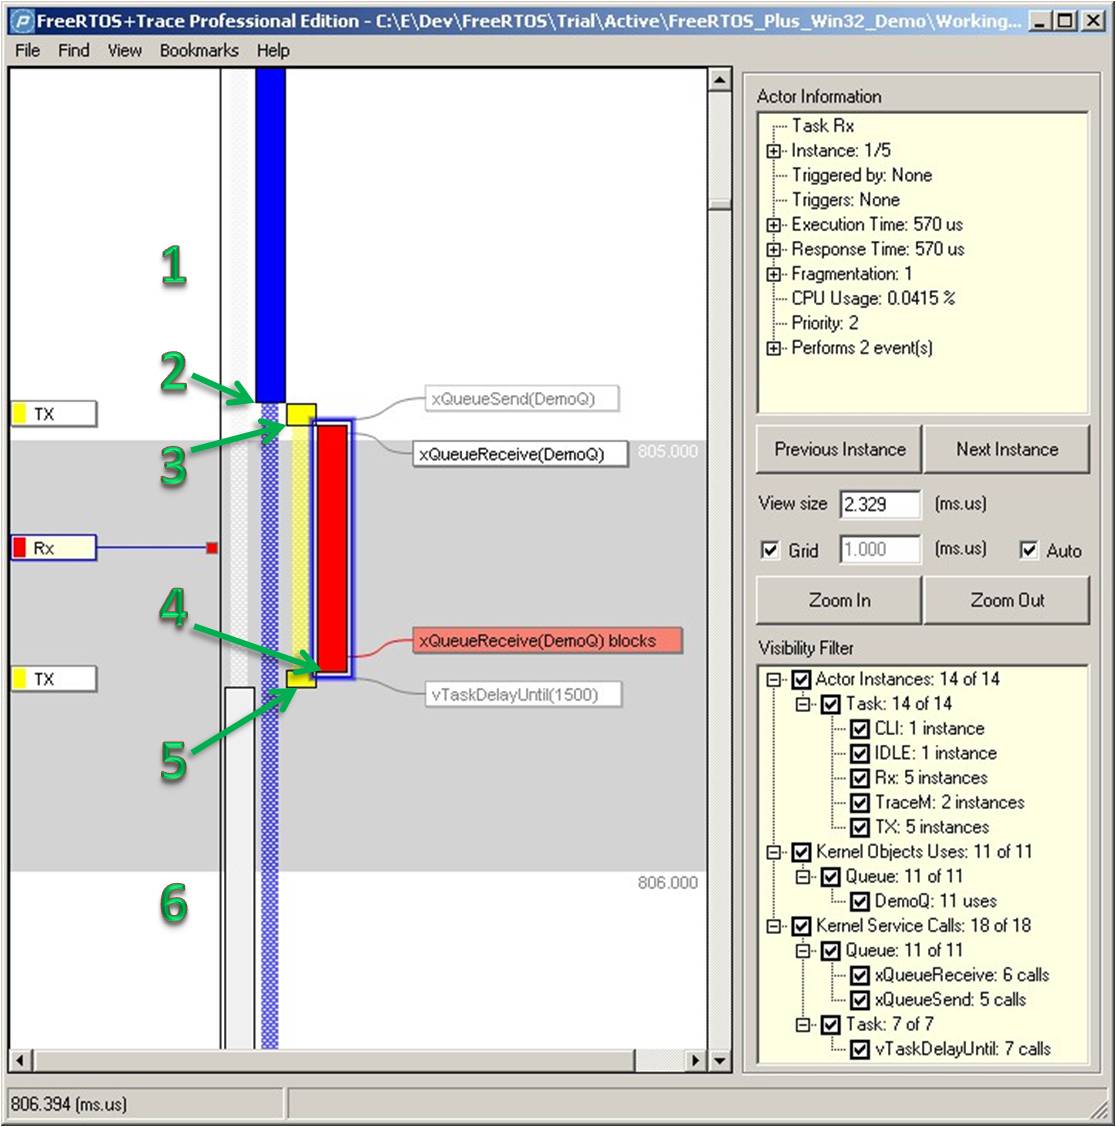 Viewing the recorded RTOS trace in FreeRTOS-Plus-Trace with explanatory annotation
The image above has been annotated with some green numbers to highlight
points of interest. Referring to the image above:
-
At (1) the CLI task is running. In a real scenario, on real
hardware, the CLI task need only execute when there is input
to process. In this simulated environment, the TCP/IP stack cannot
be allowed to block, so the CLI task is always available to the
scheduler.
-
At (2) the Tx task (the queue send task) unblocks because it is
time for it to send another message to the queue. The Tx task
pre-empts the CLI task.
-
At (3) the Tx task calls xQueueSend() to send a message to the
queue named DemoQ. The higher priority Rx task (the queue receive task) was blocked
on the queue, waiting for a message to arrive, so it now unblocks and
pre-empts the Tx task.
-
At (4) the Rx task calls xQueueReceive() again, but the queue is
once more empty so the Rx task re-enters the Blocked state (signified by the
red colour of the xQueueReceive() label in the trace view) allowing
the Tx task to enter the Running state again.
-
At (5) the Tx task calls vTaskDelayUntil() to enter the Blocked
state until once again it is time for it to send a message to
the queue.
-
At (6) the idle task is running.
Going Further
This simple example has only demonstrated the basic functionality. The
FreeRTOS-Plus-Trace download contains a much more comprehensive FreeRTOS
Windows simulator project, along with pre-recorded example trace log files.
Visit
the Percepio Website for more
information.
Copyright (C) Amazon Web Services, Inc. or its affiliates. All rights reserved.