TracealyzerTM
Unprecedented visibility into the run time behaviour of FreeRTOS applications
A Selection of the 30+ Graphically Interconnected Views
Click an image to enlarge
Tracealyzer introduction video
Introduction
The FreeRTOS kernel provides real-time multithreading, which brings many advantages, but also another dimension for developers to consider – the concept of tasks and their runtime interactions. Visual trace diagnostics can be viewed as a surveillance camera for your FreeRTOS application that allow you to see a timeline of software events, spot issues in high level overviews, and drill down into sequencing details. This is often a valuable approach for debugging, verification and optimisation of FreeRTOS applications.
Tracealyzer from Percepio is a powerful runtime analysis tool that can be used side-by-side with a traditional debugger, and complements your debugger by visualising the real-time execution of tasks and ISRs, including FreeRTOS API calls and your own “User Events”
Percepio Tracealyzer can be used simultaneously with a traditional source-code debugger using the same debug probe. It does not require any special tracing hardware. To learn more about how visual trace diagnostics can simplify and speed up FreeRTOS application development, check out the articles in the Percepio RTOS Debug Portal and read the quick start guide.
Examples of views and data
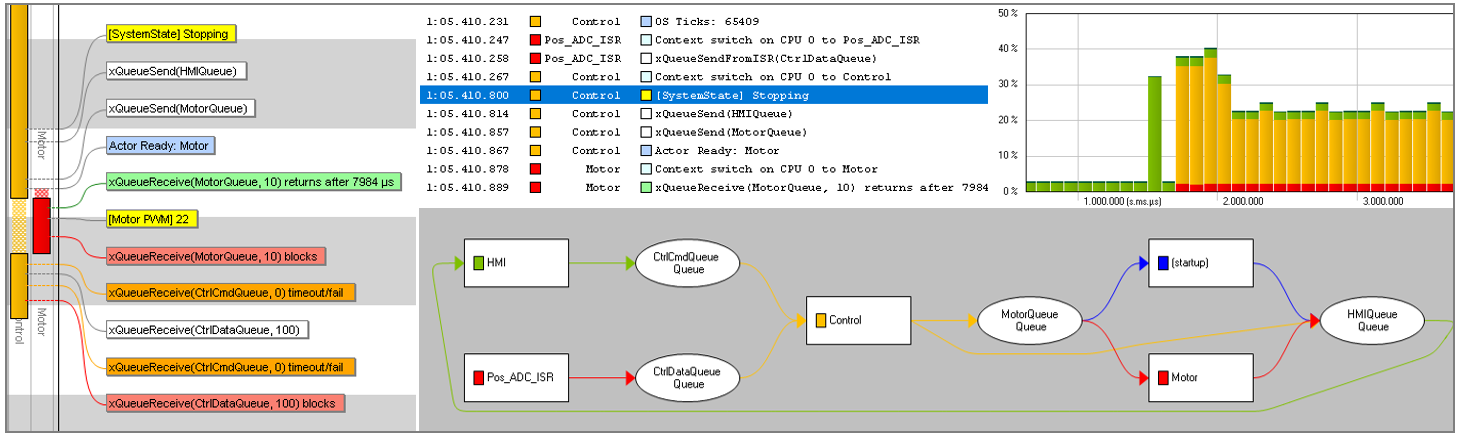
Tracealyzer offers over 30 interactive views at different abstraction levels, both overviews and details. The views are interconnected for a streamlined workflow and include data from both kernel events and user events, i.e., optional logging calls in the application code.
Timeline of task execution, ISRs, API calls, user events, etc.
Graphs over CPU load, stack usage and dynamic memory allocation.
Statistics on task timing (response times, execution times, etc.)
User event plot – visualise any data logged as user events.
Custom intervals – see the time between two user events.
State machines – get state diagrams from user events.
How it works
The FreeRTOS kernel contains over 100 “trace hooks” at strategic locations, like the example below.
Tracealyzer includes a trace recorder library for FreeRTOS that uses these trace hooks to record important kernel events. No modifications of the FreeRTOS source code are needed, only a rebuild to enable the hooks. The trace recorder library is designed with 32-bit MCUs in mind and is highly memory efficient. The processing overhead is measured in microseconds per event and is typically not noticeable, although this depends on the application and processor speed.
The trace recorder library also allows for adding your own custom logging in the application code, for instance regarding variable values, state changes and register values.
The trace data can be transferred to a host computer continuously (streaming mode) or stored to a ring-buffer in target RAM (snapshot mode) for upload on demand. No special tracing hardware is needed for snapshot mode. Streaming mode requires a streaming channel to the host computer with sufficient capacity, such as a network connection, USB serial connection or microSD card.
The recorder is highly configurable and includes several types of predefined streaming support.
The Tracealyzer host application runs on Windows and Linux.
Example Views
Click the links below to see a selection of example Tracealyzer screen shots. Each image is accompanied with a brief explanation.
Screen Shots of Various Tracealyzer Graphical Views